Does society’s control influence and direct us for better or for worse?
Word Count: 1467
This project will attempt to investigate how law and order through road signs controls and enables society to function. Within society road signs are a part of how we live and from an early age we learn to interpret their meaning. When conducting the research, it became apparent that power and instructions within society shape the way in which we live. In order to look into this in more depth I decided to set my research question to; Does society’s control influence and direct us for better or for worse? This project set out to answer this question through the use of visual research. Recording data through a blog aimed to cover issues such as; methods used, arising themes and codes that were brought to the researcher’s attention through the analysis of the use of images as data. Using imagery as a source of data has been a point of discussion for researchers in that it can be problematic for the researcher in creating a bias that may project the researchers own aim or angle. However, this has been debated throughout the reasoning of the camera never lies. In other words, visual research can be argued to be the most beneficial piece of research in which no manipulation will be present (Prosser 2005). It can therefore be argued that the researcher has picked a strong form of research to undertake the task.
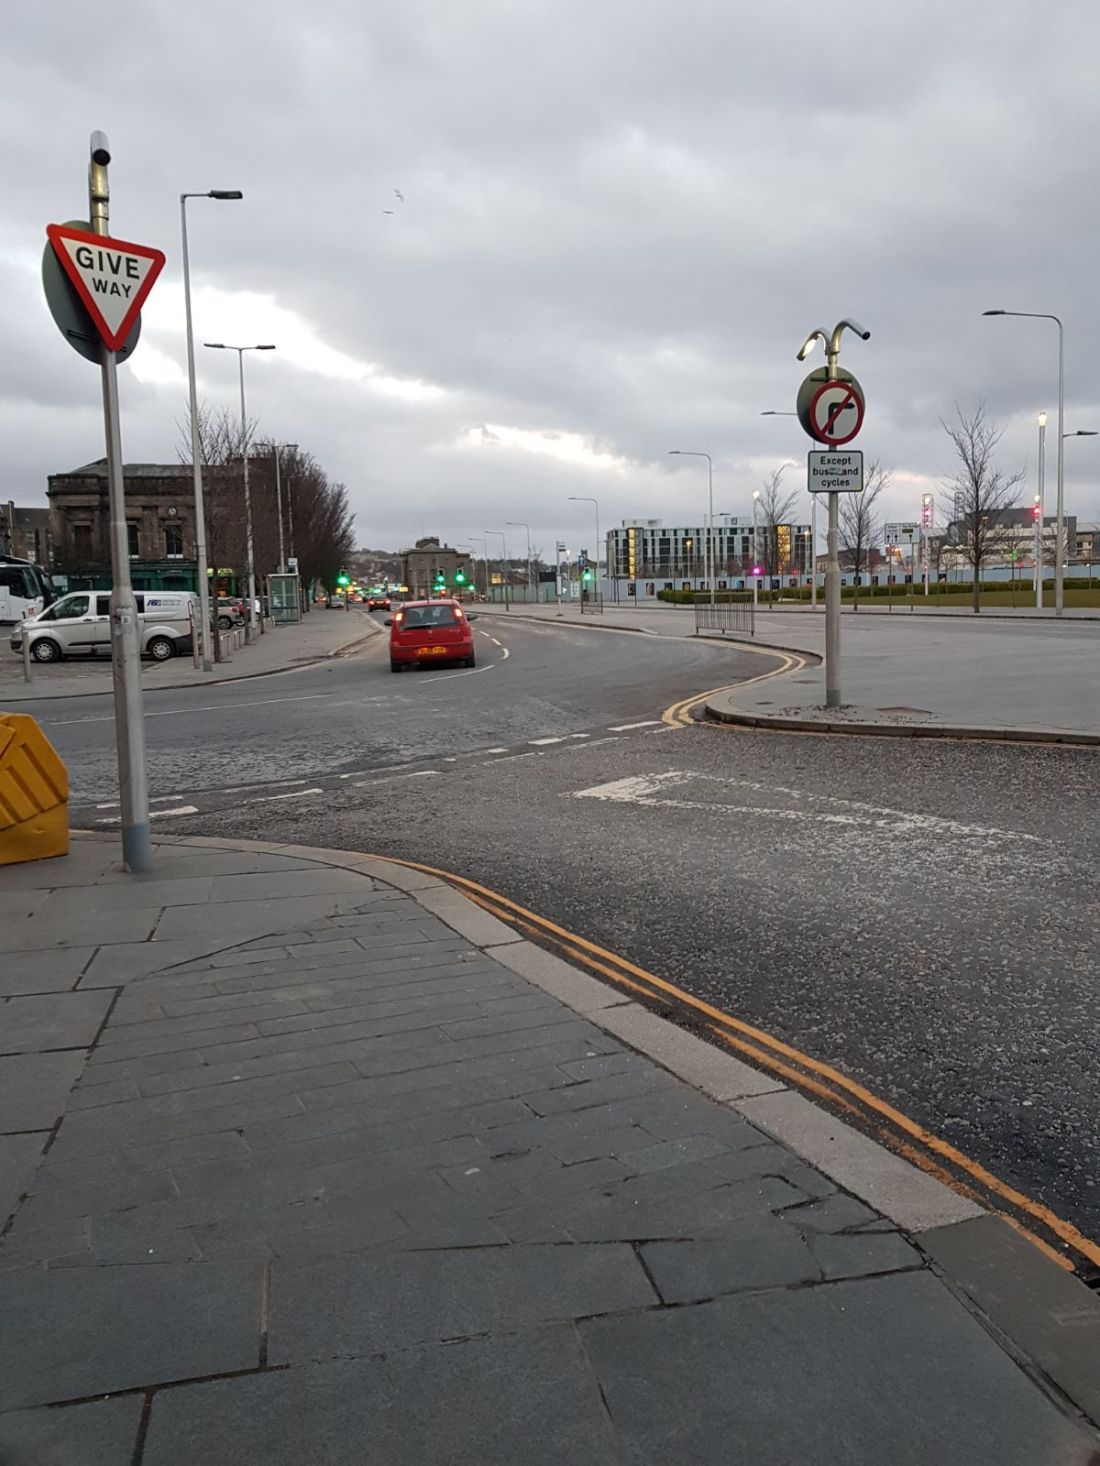
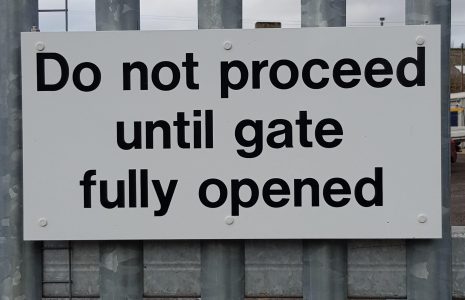
When first selecting the angle I was going to set out with in regards to road signs I chose to see what the definition was, by the U.K. Department of Transport, (1991, p. 4) as an integral part of the road environment that can include not only upright signs giving warnings and instruction to traffic, speed limits, directions and other information, but also road markings, traffic light signals, motorway matrix signals, zebra and pelican crossing and cones and cylinders used at road works. For the instance of this project signs would be defined as observable substances. The idea of the image we generate in our minds that associates the desired learnt meaning (Guiraud 1975). Interestingly Wales 2001 states that signs have no connotation unless people can see the connection to the signs.
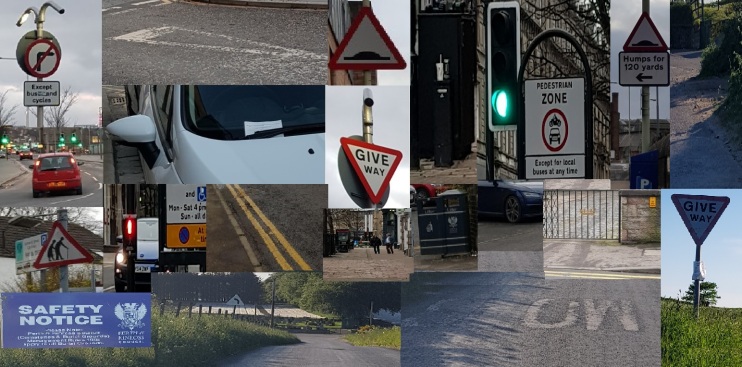
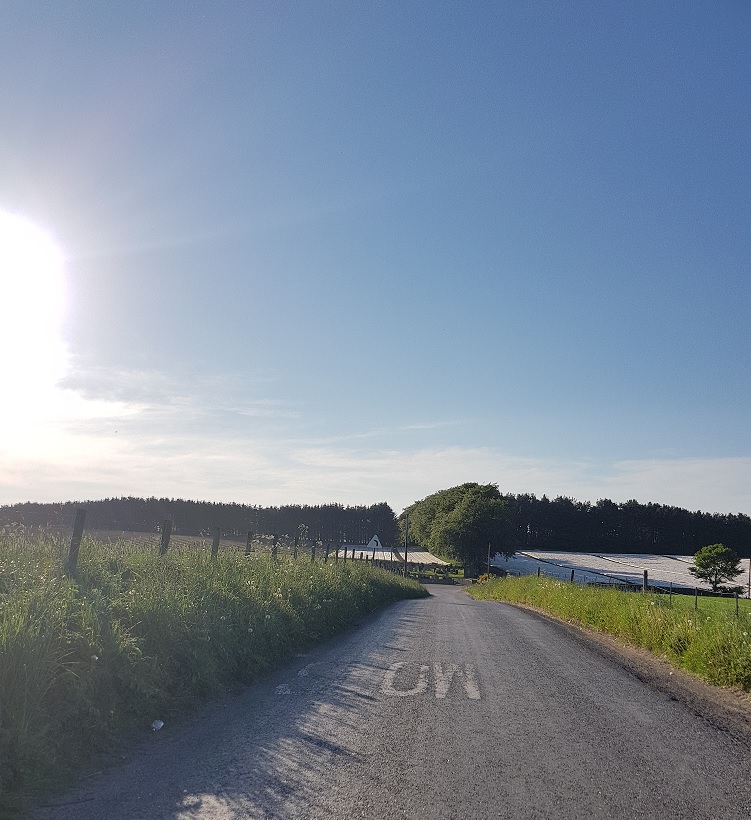
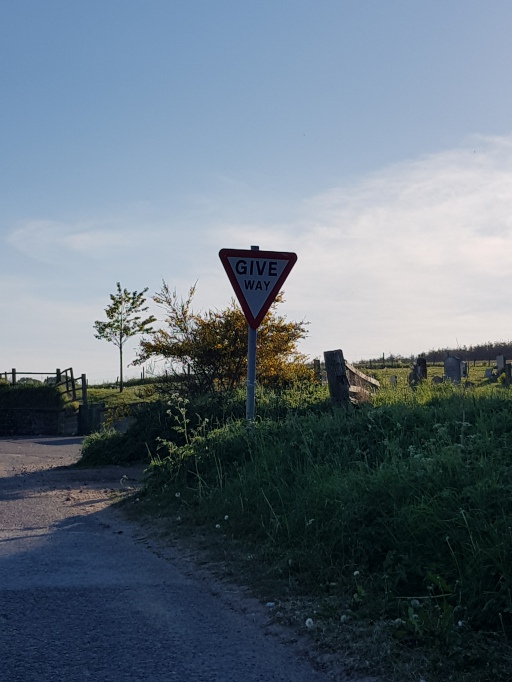
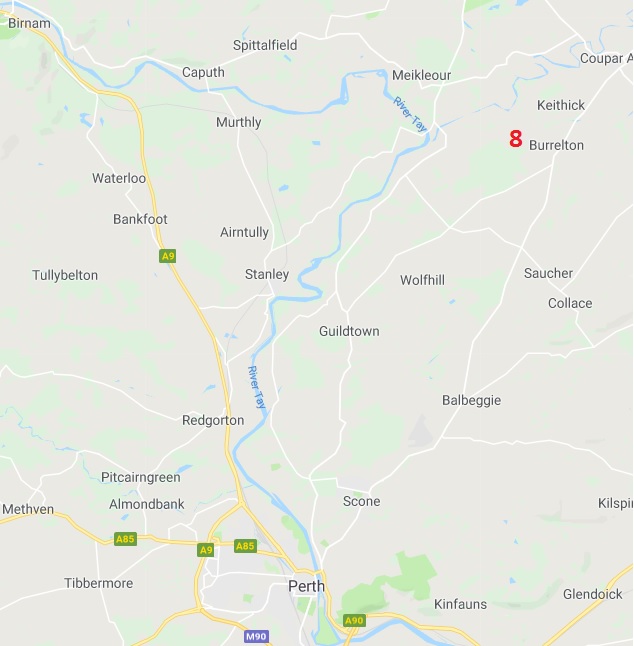
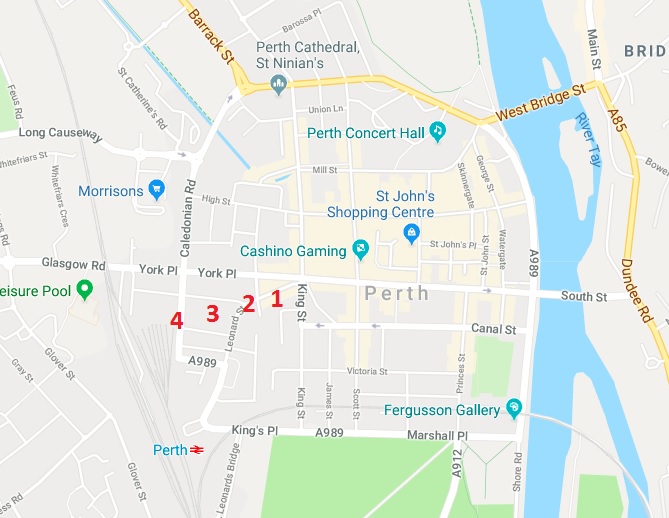
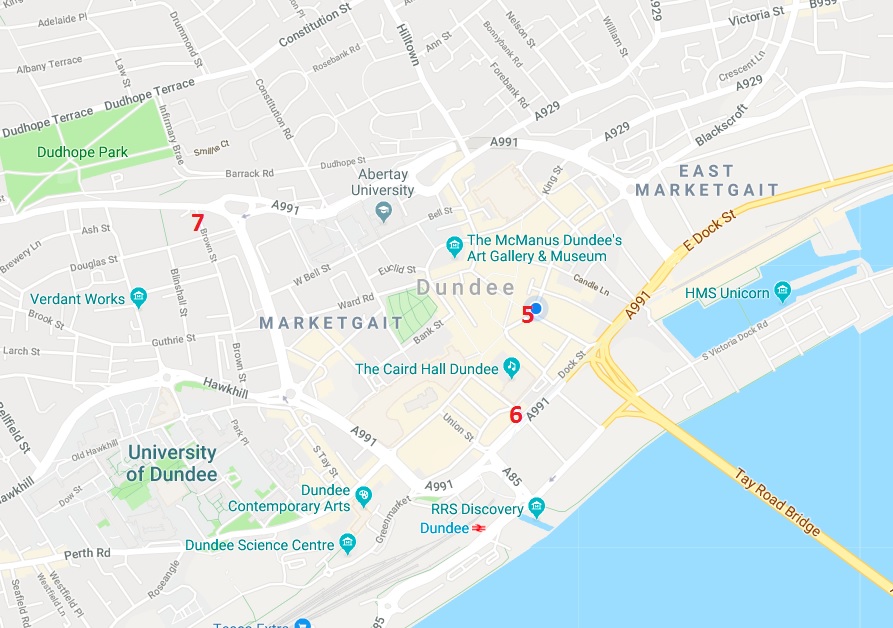
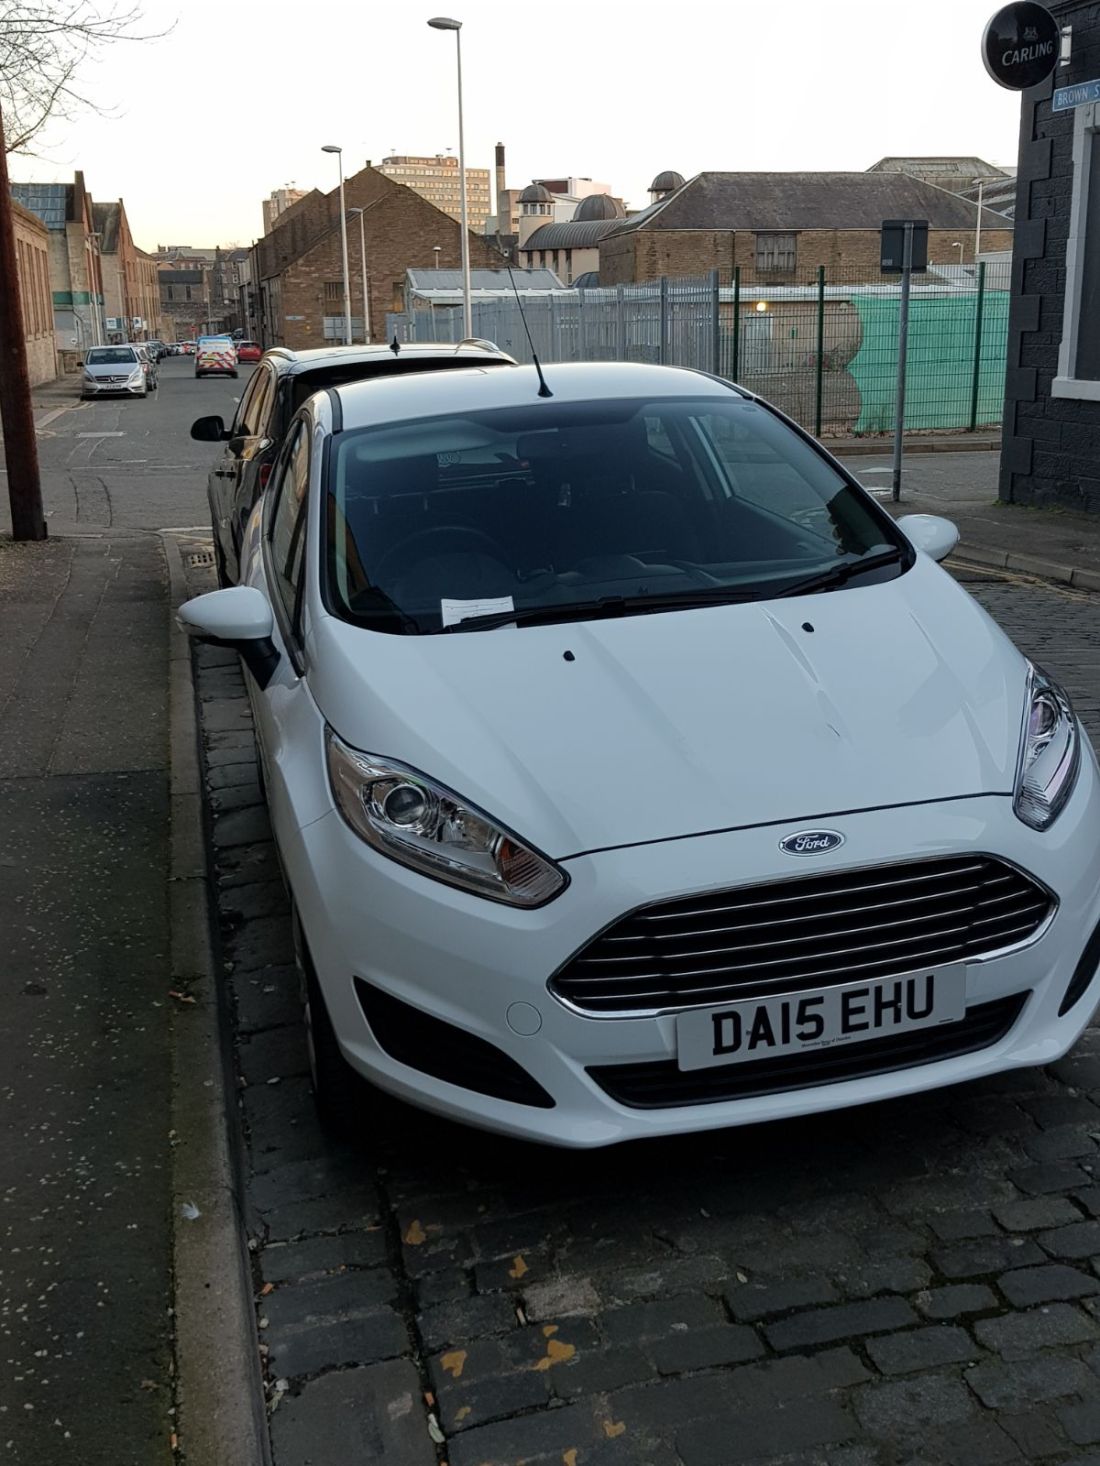
Whilst thinking of how best to tackle this project it became clear that it would be most useful to be in the chosen facility in which I would be gathering my data. This enabled me to see how people live within their living space. I chose initially to stick to Perth city centre where I photographed road signs and the locations that they were set in. Here I was able to observe how society acted towards the rules and regulations set out with each sign. Taking parking restriction signs for example, during peak times these allow for many people to access business and shops for a short period of time (Dunwoody 2006). If there were no restrictions what would the implications be? Will people stay for longer if there are no restrictions? If so, then there are obviously less chances for other people to park. Within some parking bays there are parking regulations set in place to stop people from parking too long. Gathering the images of the road signs had no issues due to the large number of signs located throughout cities. The use of visual research is one that is very new to me and I did find it really challenging as you are limited to what can be interpreted through only visual information rather than writing which can be more informative. I did however enjoy using a camera as my main source for data gathering. It taught me how important it was to get a clear and a good angle for my chosen subject.
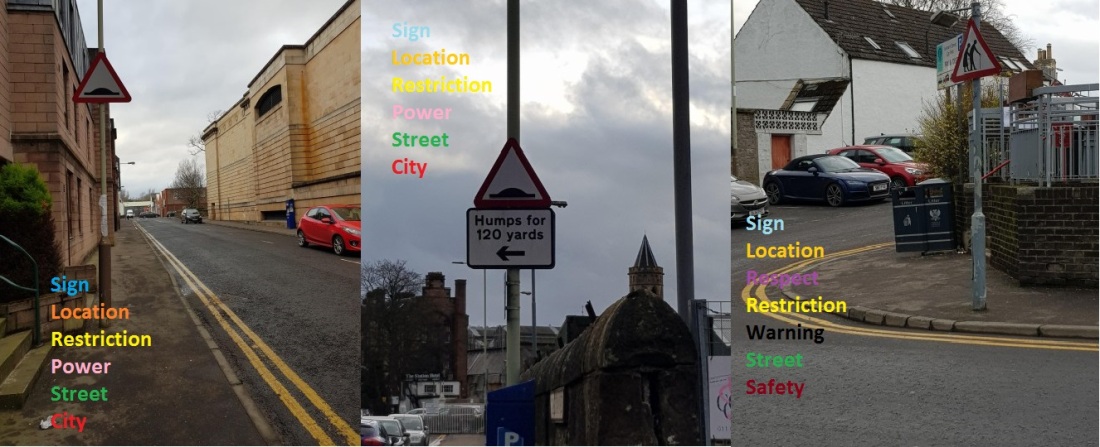
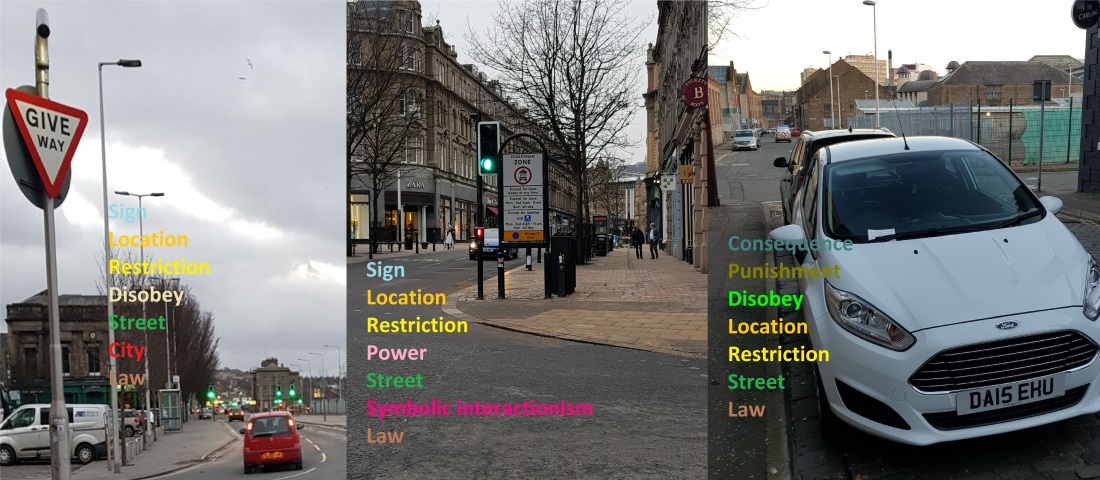
When looking at the images that I have taken it can be argued that they look just like road signs. With this in mind I undertook more research in regard to the signs and how they are applied to society in regards to my research area. Through this I began to question how important the road signs were in our day to day lives and what aspect of the sign had greater importance. One question that struck, is the sign or the content portrayed on the sign more important? With these questions it lead me to examine theories from Freud’s sense of identity, discourse and symbolic interactionism.
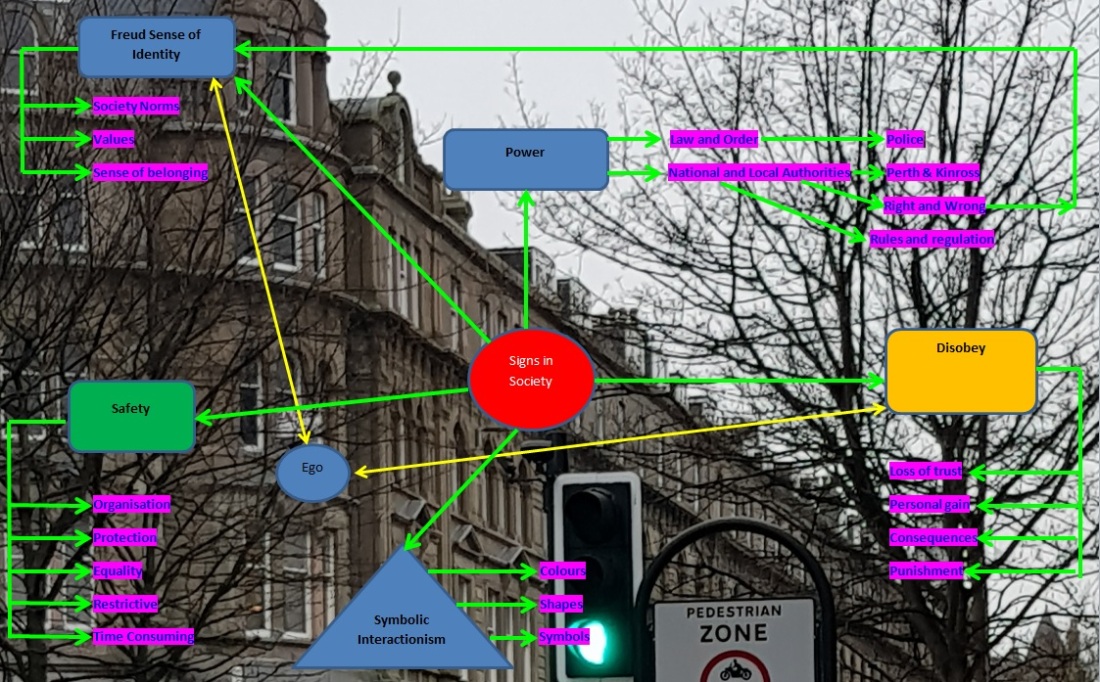
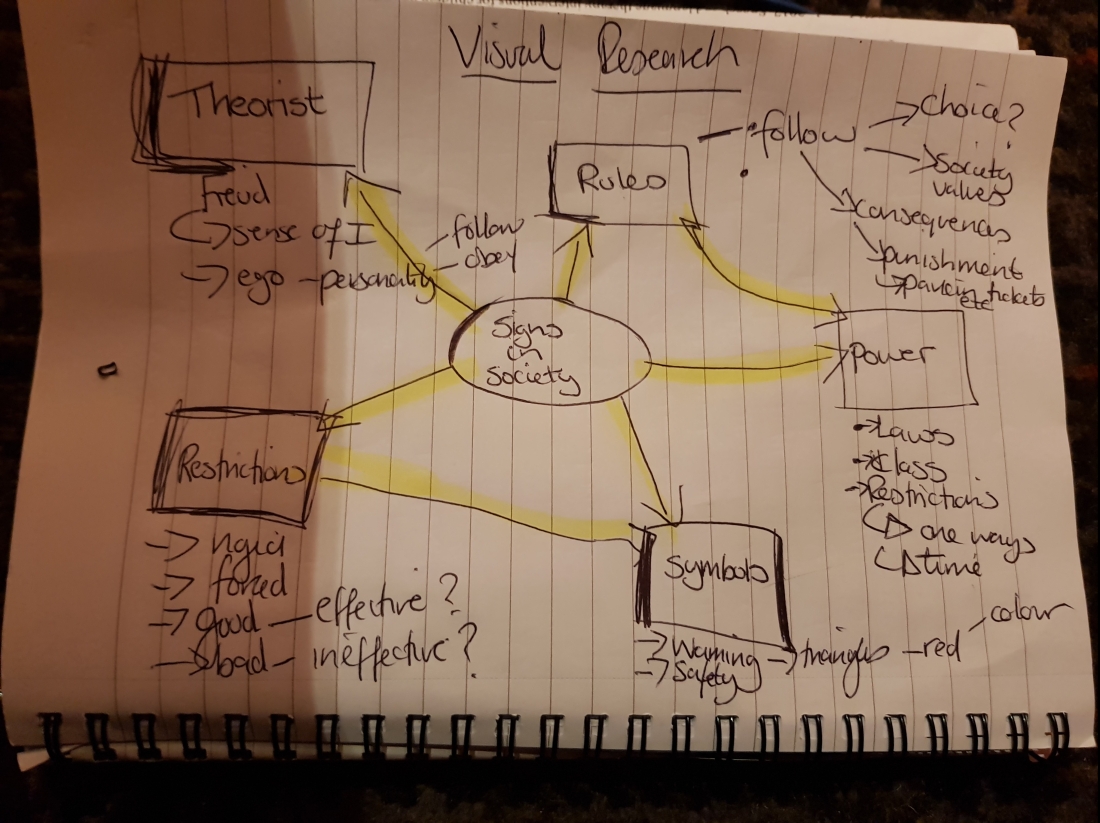
When trying to pin point key themes for this piece of research I came across this quote which gave me inspiration, “Research is to see what everybody else has seen, and to think what nobody else has thought” (Derval 2010). This made me question how I could approach this research differently from how I would normally carry it out. From being in the midst of the data it allowed me to achieve a different approach to my mind map. Through being in the location at the time it gave me the idea to use the photograph as the background to my mind-map which gave more power and memory recall which made me feel more engaged with my research. Through my mind map it allowed me to arrive at two main theorists; firstly Freud’s sense of identity and symbolic interactionalism. Freud believed that the human personality was a complex piece with multi-layers which consist of the id, the ego and the superego (Freud 2018) These three layers form our personalities which make us very complex and influence how we interact as individuals this is where the theory for the research stems from. It can be argued that from the foundations in which we are socialised to can form our understanding of the world around us. Therefore how we are programmed to interpret information shapes the society we live. The ego specifically is the area in which I was mainly interested in with regards to how we follow certain rules within society and how this affects how we interact. Freud believed that this is learnt behaviours in which our parents and authority figures set out behaviours that are acceptable to us Freud 2018. This links perfectly with that of symbolic interactionalism where it focuses on the relationships between individuals within society.
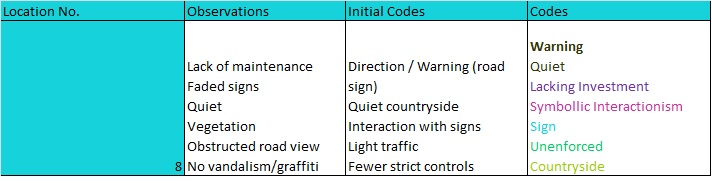
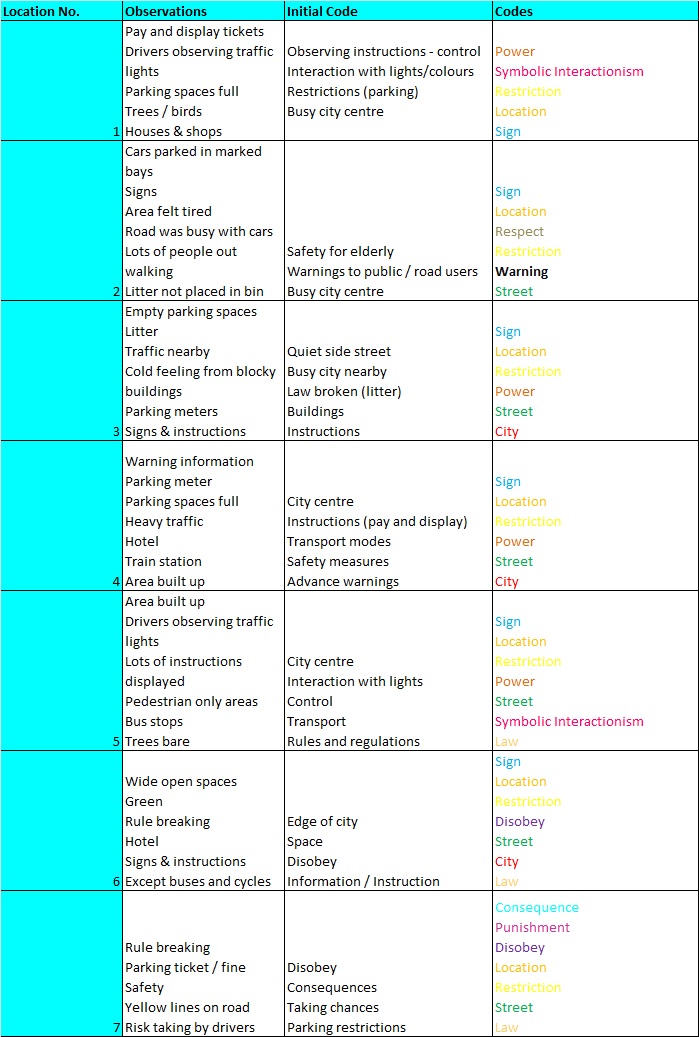
Once I had gathered my locations and sign images I chose to do thematic analysis as it is one of the most commonly used techniques in qualitative research. (Guest et al 2011).Thematic analysis is used to simply analyse the data. It has been found that both words and images are more influential than statistics (Prosser 1998). Thematic analysis consists of pinpointing out themes that are present in the data, in this instance the images of road signs. This process is used to identify patterns of data. I found using this method made it easier to distinguish themes that arose from the images I had taken. From the themes that were established I decided to use coloured text to make the themes more visually digestible. I chose to do this process manually as it was more efficient. Due to the nature of my topic being so narrow it made perfect sense for me to do this. Through colour coding it made the process of building upon themes more manageable.
I found that using visual methods strengthened the abundance of data which I had unveiled with further layers of meaning which combined more validity and intensity to my results. I found that it added more effectively to the traditional methods in which grabbing further details in a more distinctive way than that of written and verbal methods. Visual images can also be used to understand the way in which people live their lives and visual influences they have had throughout their life course (Bekkers 2014). This was a great way for myself to investigate the question of Does society’s controls influence and direct us for better or for worse? I was able to visually observe my subjects in their own environment without causing any rigour in my results. There was no bias due to the images speaking for themselves. I feel that by using visual methodology you can use it for any age and language as it is all visual. It could be seen as a universal way of communicating data effectively. Images are representations of how subjects interpret their contexts, relationships, decisions and realities (Spencer 2010). I feel that it can be argued that signs do influence how we interact. I feel that it comes down to your social upbringing and how you are socialised whether or not you chose to follow the restrictions or not. Perhaps future research could go into social background to see if this influences how we react towards signs in society. My research only touched the surface of this topic and I feel that further research would be required in order to gain the bigger picture.
References
BEKKERS,V., 2014. Visual Culture and Public Policy: Towards a visual polity?. 2nd ed. London: Routledge.
DEPARTMENT OF TRANSPORT., 1991. Specification for drawing and marking: warning signs. London: Department of Transport.
DERVAL,D., 2010. The Right Sensory Mix: Targeting Consumer Product Development Scientifically. 2nd ed. Germany: Springer Science & Business Media.
DUNWOODY,G., 2006. Parking Policy and Enforcement: Seventh Report of Session 2005-06. London: The Stationery Office.
FREUD,S., 2018. The Ego and the Id. 1st ed. United States of America:Courier Dover Publications.
GUEST,G. et al., 2011. Applied Thematic Analysis. 2nd ed. United Kingdom: SAGE.
GUIRAUD,P., 1975. Semiology. 2nd ed. London: Routledge.
PROSSER, J., 2005. Image-based Research: A Sourcebook for Qualitative Researchers. 2nd ed. London:Routledge.
SPENCER,S., 2010. Visual Research Methods in the Social Sciences: Awakening Visions. 1st ed. London: Routledge.
WALES,K., 2001. A dictionary of stylistics. 2nd ed. Harlow: Longman.